
As you learn SEO, it’s important to understand how to track your results. You need to know if what you’re doing is working, or if you should change your approach. In this article I am going to show how you can easily see if you are making progress with the big G.
Make Data Driven Decisions
One of the most important lessons I’ve learned over the years when it comes to marketing is this:
Always make data driven decisions, not choices based on your gut.
Sometimes your gut can be wrong.
You always want to back up any business decision with raw, hard numbers.
Luckily for us, it is very easy to gather real information about the status and progress of your SEO. There are several tools we can use, all of which are free. By taking the time to set up these things, we can easily rest easy knowing we are monitoring our results.
Getting Started With Google Analytics
Google Analytics, if you weren’t already aware, is Google’s data monitoring and collection tool for website owners. It allows you to track:
- Where your website visitors come from
- How long they stay on the page
- The pages visited
- Geographic information about them
- Demographic information (age, gender)
- Conversions & website events
Luckily, this is easy to set up.
Setting It Up
To install Google Analytics on your website, we’ll need to first log in to it. Head over to Google Analytics and sign in by clicking on the button in the upper right. If you have a Gmail account, you’ll already have an account. Otherwise, you can sign up for a free one.
Once logged in, we’ll have to add our website.
It should pop up with a screen that looks like this:
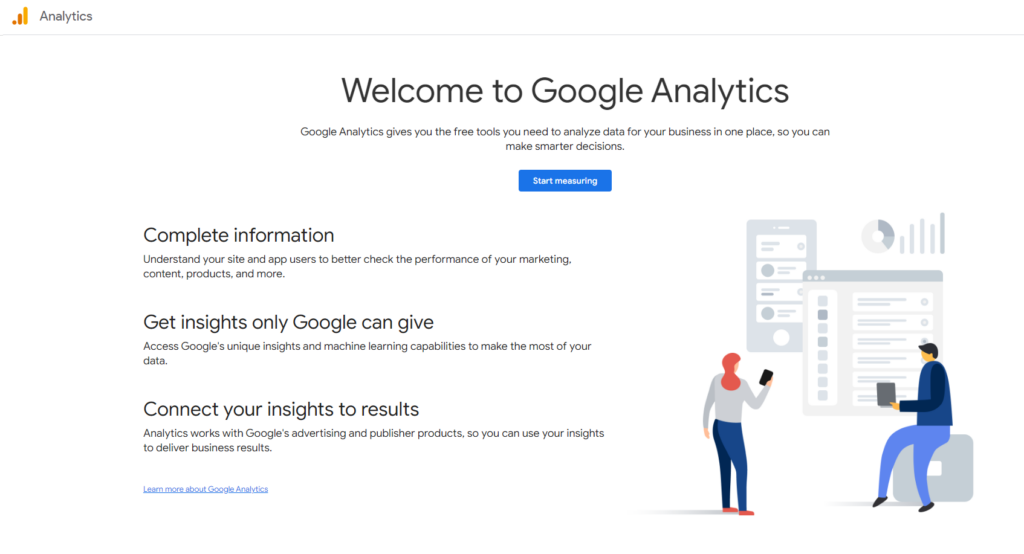
Click on the blue “start measuring” button to get started.
For account name, you can enter whatever you like. I recommend putting the name of your website in this box. Uncheck all the boxes. We do not want to send anonymous data to Google about what our website visitors are doing.
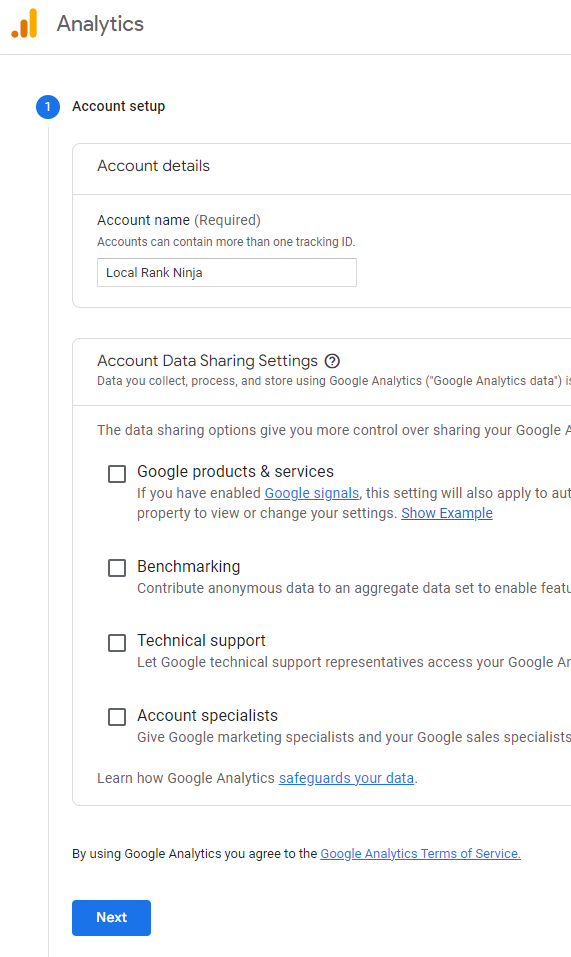
Then, click on the blue “Next” button to proceed.
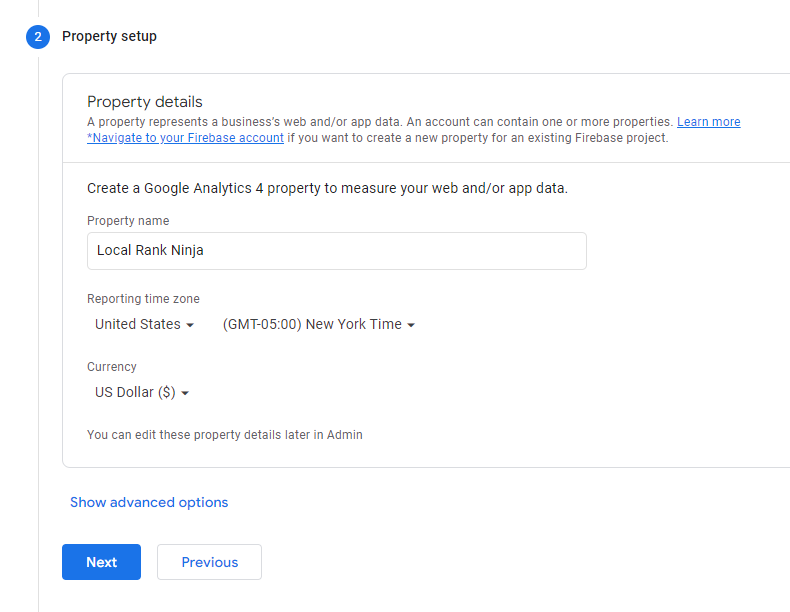
Now it will ask us to set up a property. A property is simply a website. You can have multiple websites added inside one Google Analytics account. If you are a business owner, most likely you won’t be doing this. Marketers will find themselves commonly having this be the case for them.
I know this can get confusing since we named our Account our website name as well, but once you become comfortable with the inside of Google Analytics, I can promise you this will make more sense. Don’t worry about the difference right now.
Enter your website name again in the “Property name” box. Make sure to select your country, timezone, and currency and click on the blue “Next” button yet again.
Finally, Google will ask about your business. Select what industry category best represents your company, and check all the goal boxes that are relevant to you. Once finished, click on the blue “Create” button:
Accept the terms of use by clicking on the checkbox next to “I accept the Data Processing Terms as required by GDPR.” Then click on the left button that says “I Accept”.
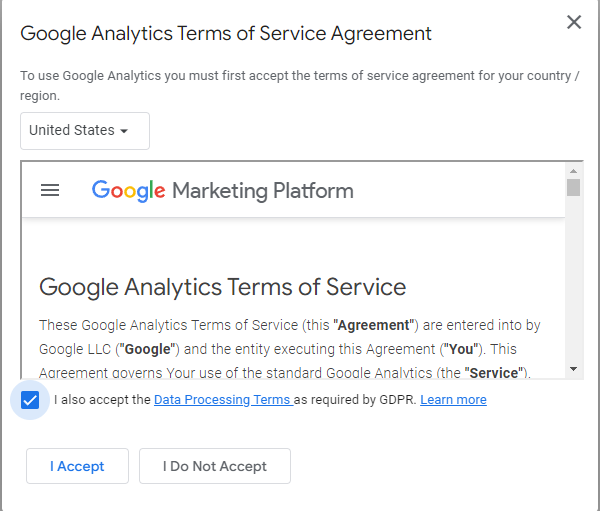
We are in! All that’s left to do is install the tracking code on our website.
Installing The Tracking Code
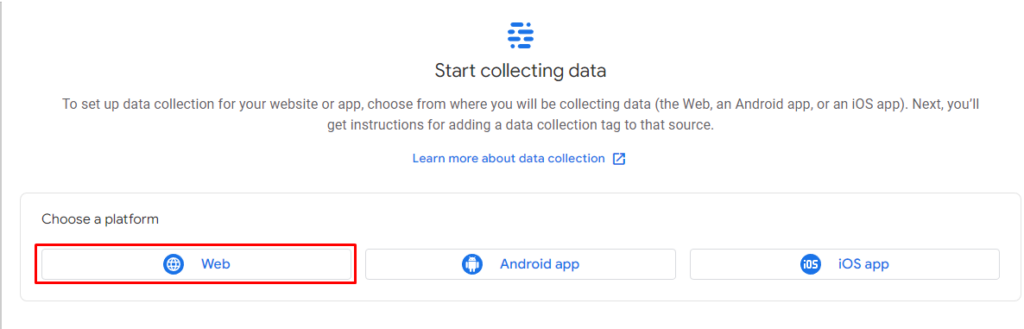
You’ll notice that Google Analytics prompts you with 3 different options. For platform type, choose “Web” since we’re installing this on our website.
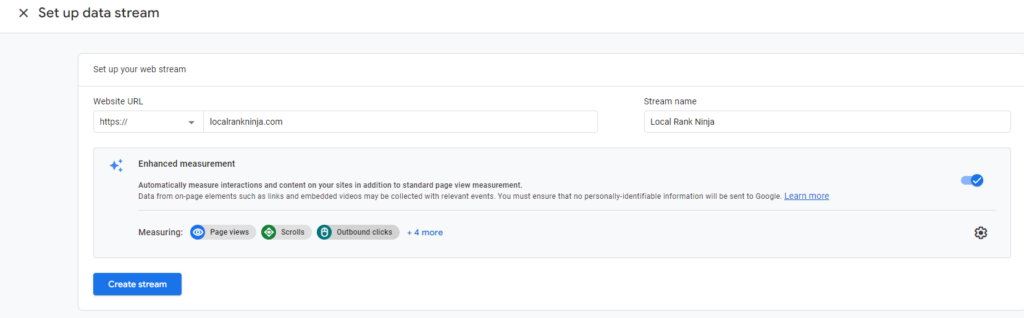
A box will pop up asking you for your website information. Put in the URL of your website in the first box, and enter the name yet again in the second one. Then, click on “Create stream” to get your tracking code.
NOTE: Leave the “Enhanced measurement” box checked. This is important to gather as much information as possible in reporting for later.
A step by step guide will come up on screen. It’ll walk you through how to install it. Go ahead and click on the “Install manually” tab.
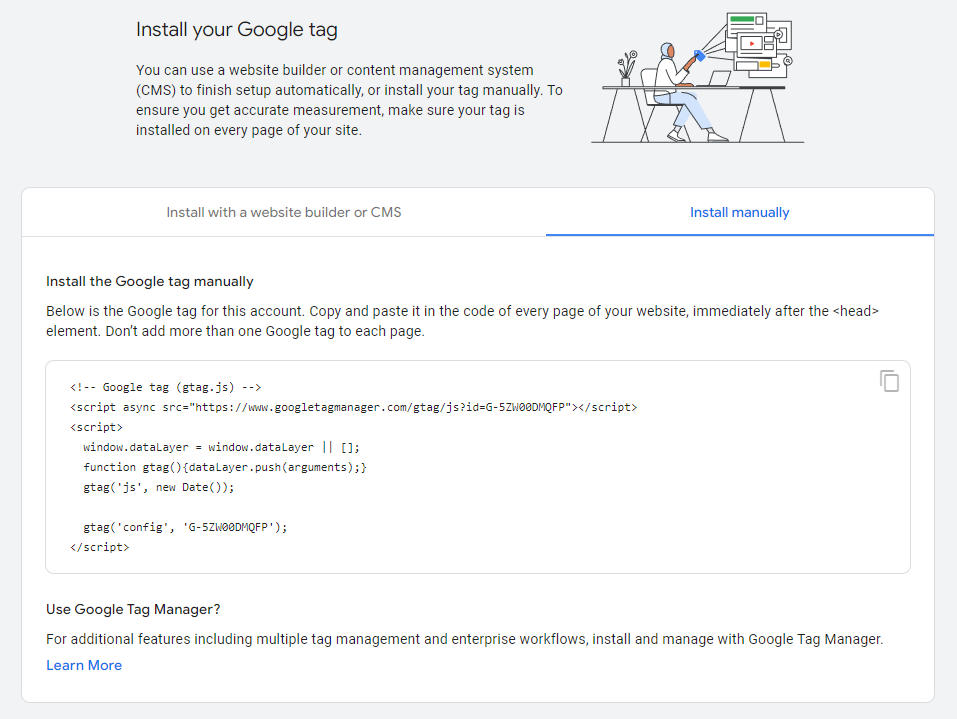
Now it’ll finally give you the code we need! Go ahead and click on the icon that looks like 2 sheets of paper. This will copy the code for you.

Now log in to your WordPress dashboard, and click on “Plugins on the left hand pane. Then click on “Add New” at the top. We’re going to go ahead and type in “Insert Headers and Footers”. This will bring up several plugins. Install the one by WPCode.
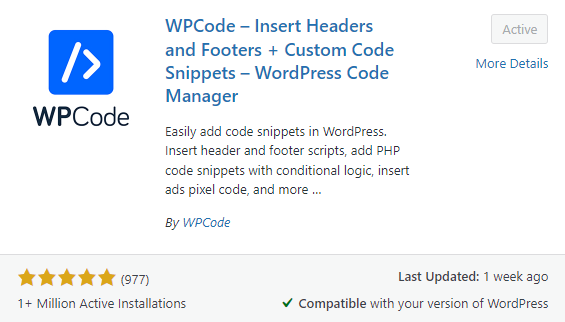
Once installed, click the blue “Activate” button.
This plugin will help us insert the tracking code on every page, post, and section of our website with a few easy clicks. This way we can track visitors across our entire website, which is important for several reasons. If you were only tracking visitors on your home page, for example, this would be pointless. Yes, we could track some users who land on that page. But what about visitors who click on one of your blog posts or other pages in the search results…?
That’s why it’s vital that we enable site-wide tracking with Google Analytics.
Anyways, it’s time to paste our code.
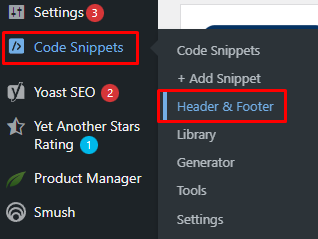
Hover over the new “Code Snippets” option in the left-hand pane of the WordPress dashboard. Then click on “Header & Footer”.
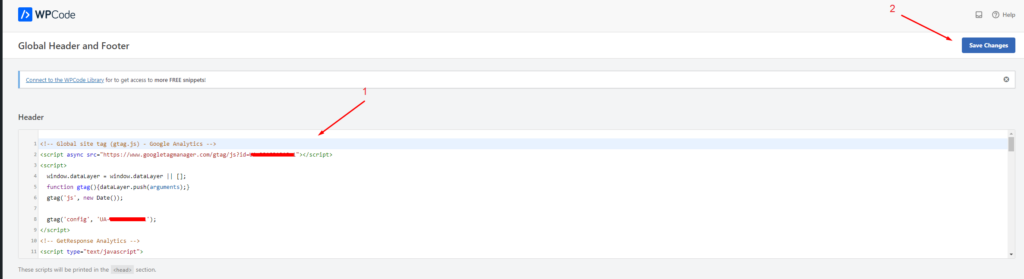
In the “Header” box paste in the code we copied earlier. Then click on the blue “Save Changes” button in the upper right.
Congratulations, Google Analytics is now implemented on your website! Give yourself a big pat on the back. I know that this process may have seemed intimidating, with the code, plugins, and navigating through a new tool. But you did it! This is a big step in the right direction for your SEO efforts.
Using Google Analytics
Now it’s time to get into using Google Analytics on a day to day basis. We’re going to talk about how to identify important key metrics such as the number of visitors you have, along with navigating the Google Analytics dashboard. This section is important in becoming fluent with Google Analytics.
The Dashboard, Explained
The inside of your Google Analytics will look something like this:
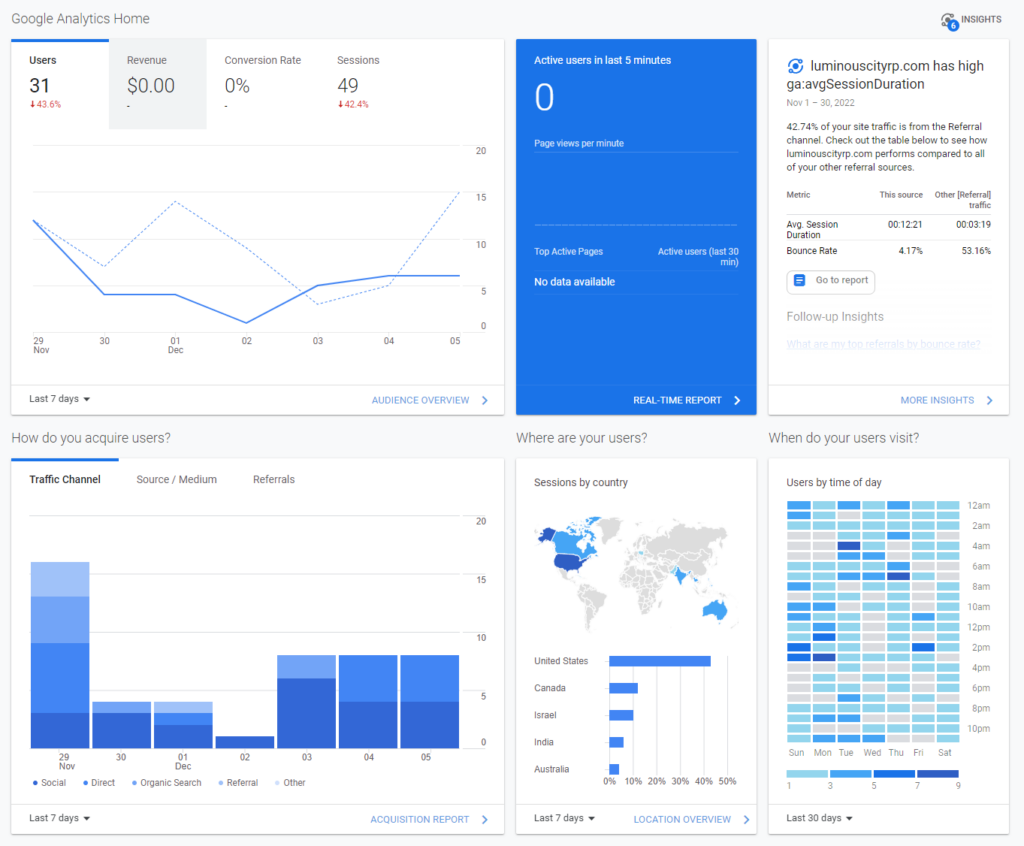
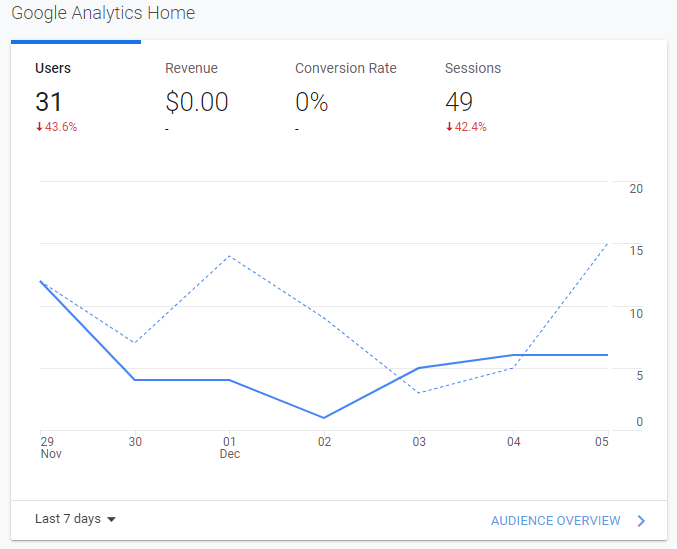
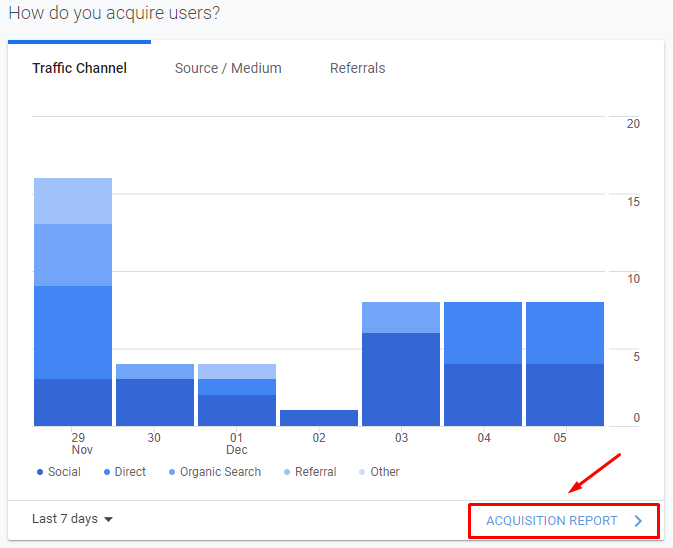
Let’s start with the top part of the dashboard. Under “Google Analytics Home”, I can see a graph that shows me how many visitors I have had in the past 7 days. I can also see how many sessions there are.
At any time I can expand each section of the dashboard by clicking on the blue buttons with the right arrows beneath each section. For example, I can pull up more information about my traffic channels by clicking on “Acquisition Report” underneath that part of the dashboard:
While we’re looking at this first section of the dashboard, though, it’s important to differentiate sessions from users.
A session is the duration of time a user browses your site. One user can have more than one session. Users represent the total number of people that have been to your website in this given period of time.
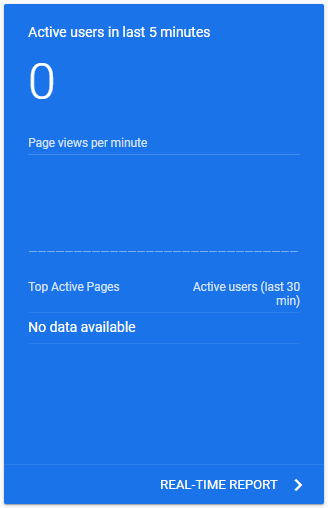
Moving along to the right, we have “Active users in the last 5 minutes”. This part of the dashboard shows me if there are any users on my website at this very moment. As you can see, in this example there isn’t.
To the right of that (far right) we have a traffic source that has the highest session duration. Session duration is the amount of time spent on our website. As you can clearly see, users from this website are on my page for quite a bit of time. This is actually the site where I host my email marketing campaigns, so these are users that are coming in from email.
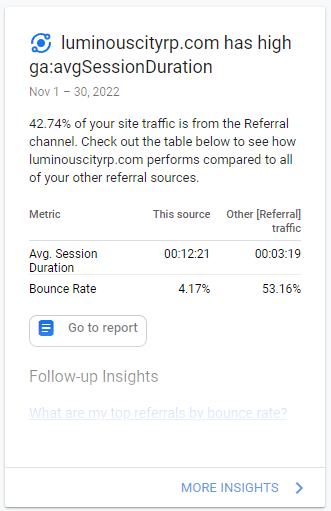
(This most likely will not be the same for you, this is a very specific example with my setup.)
Let’s now turn our attention to the second row down. This next box is very important, as it shows us where our users are coming from. This is really useful, as we can tell if these users came from search engines (in other words, how many visitors our SEO efforts are bringing into our website.)
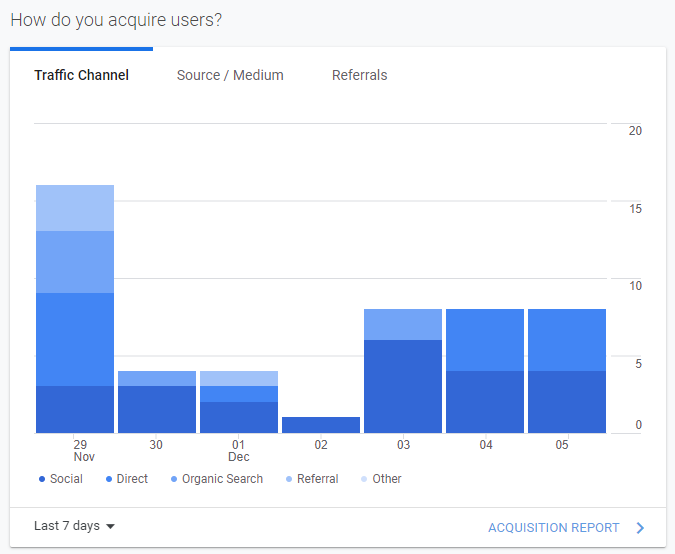
There’s actually a better section inside of Google Analytics to see this information more clearly. Sometimes the shades of blue are really hard to differentiate and many people prefer that over this graph. You can pull that up by clicking on “Acquisition Report” as I mentioned earlier.
Next up, we have visitors by location. You can see that most of my website’s traffic is coming from the United States, with Canada in close second. This is actually really valuable information.
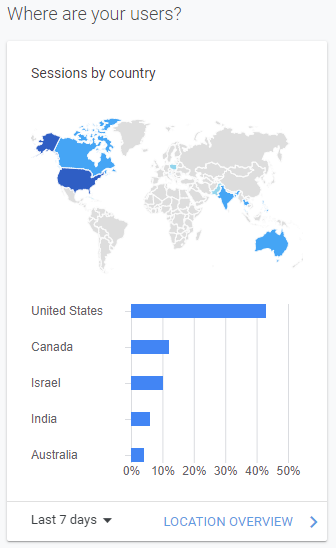
If you notice that a large amount of conversions are happening in a certain country, you can tweak your other marketing channels (ex: paid ads) to target these locations. Additionally, this can be a very important part of the dashboard if you are a local business. If proximity matters to you, you may want to occasionally look at this.
For the last item in this row we have time users visit. This is one of the most underrated metrics in Google Analytics, let me explain why. I often get asked by aspiring SEOs when the best time to publish a blog post is, and the answer is simple: use this data to determine that!
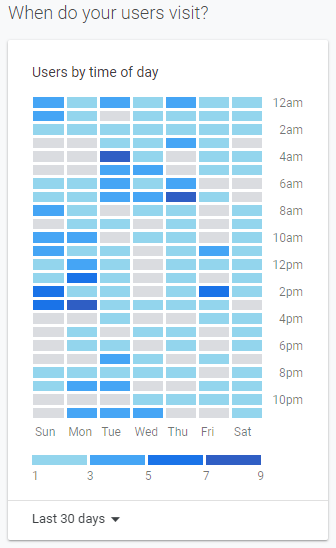
By making data driven decisions, you can easily avoid trial and error, frustration, and headaches when making choices like that. Have real data from customers to back up your publishing schedule!
On to the next row.
Ah, what pages are visited the most. This is very handy information. If you’ve published some blog posts recently, you can see how many hits these specific pages are getting compared to the rest of your website.
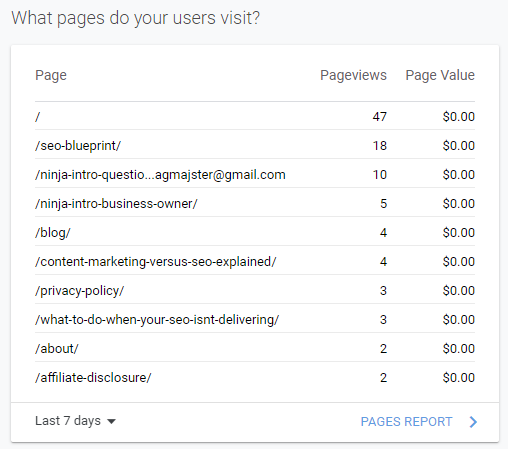
Typically your homepage will have the highest number of clicks, but this can differ. I’ve seen instances where some websites have had a blog post really take off and even beat their home page traffic.
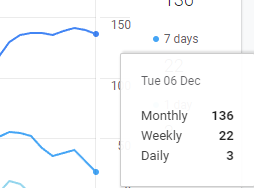
For the second item in this row, we’re looking at active users over time. This is a really important graph to look at, as it will allow you to tell if your SEO efforts are increasing your traffic over time. If this graph is headed towards a downward spiral, something may be wrong.
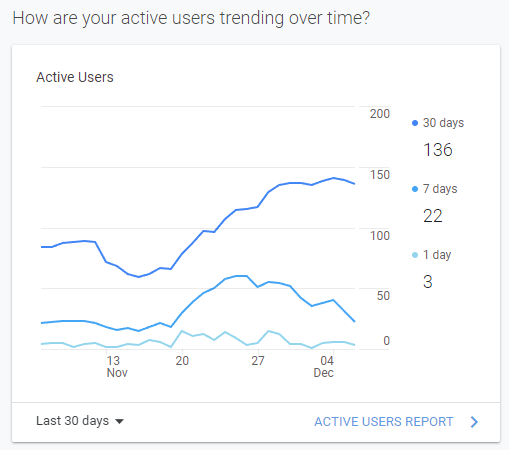
Hovering your mouse over the graph reveals more information. I can see monthly, weekly, and daily users. As you can see in this example my traffic has increased overall, but it is a slow week.
And for the final item of this row we have top devices. This is going to be more relevant if you run paid advertising campaigns. Figuring out what device type is most common with your prospects and customers is important for optimization purposes. You can tweak your pages and funnels to look especially good on the most common device type.
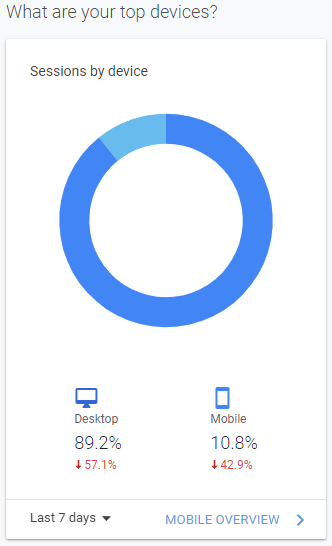
As you can see, the majority of my users are on computer – not mobile. This makes sense for the SEO niche.
This next row gives us two more items to examine. The first is user retention. I’ve talked about user retention before on this blog in great detail.
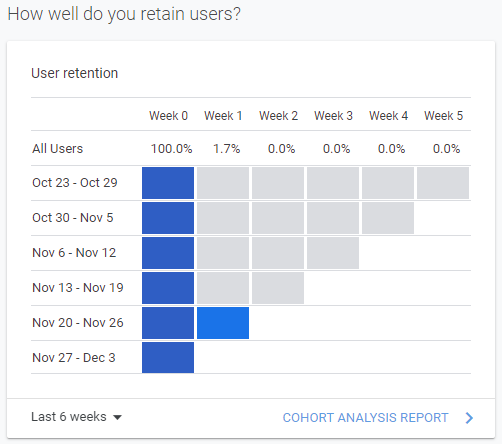
Essentially, the short and sweet version is this:
Google really cares about users coming back to your website. When they do, it sends a positive signal to the big G that your website is legit and an authority in your niche. This boosts your overall authority and ranking in search.
You need to be encouraging users to come back. The reality is most people won’t come back to your website, even if they bookmark it. By leveraging other platforms like email marketing and social media you can push people back, which ultimately improves your SEO.
Goals. This is really important, and we’re going to talk about how to set one up in a bit here. Basically, you can tell Google Analytics what you want your users to do.
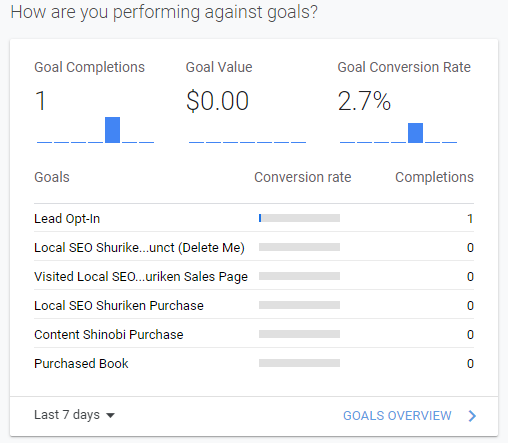
For example, if I want people to opt-in to my email list I can make this a goal. I can even assign a value to this action. Let’s say I know that each lead is worth $2 on average to my business. I can then track the value of assets acquired through SEO.
You can see that I have several goals in here. Lead Opt-In is my primary one, but I also have goals for my course and book sales. Google Analytics will also show you a conversion rate, or the percentage of people who completed the goal out of your overall total visitors.
We’re in the home stretch now! The last row gives us two items. Google Ads isn’t relevant to this blog post, so I’m going to go ahead and skip that.
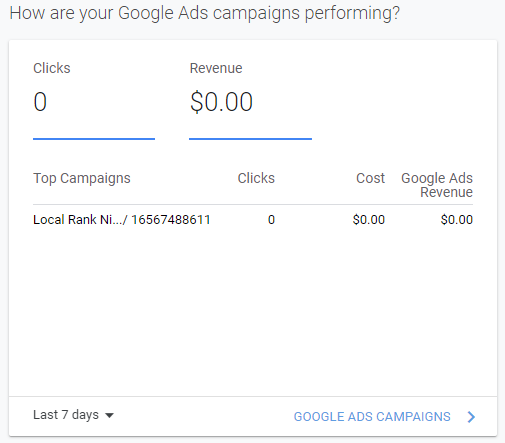
As a quick side note, if you run paid advertising campaigns you will want to link Google Ads to Google Analytics for the best tracking.
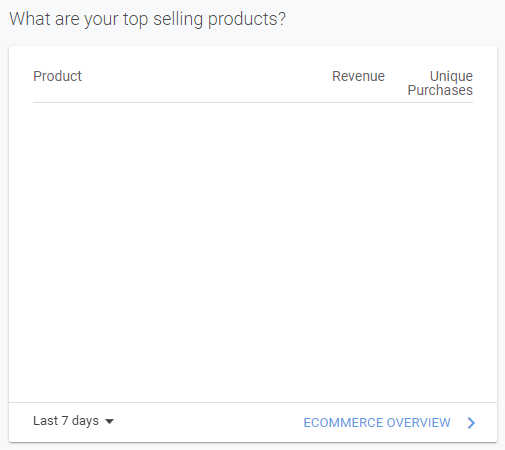
The final element shows your best selling products. This one is only relevant if your website is an e-commerce store. You can set up tracking for this. I don’t use this, and just use traditional goals to track my results instead.
What Metrics To Look At
Okay, that was a lot! I bet you’re feeling overwhelmed, so let’s simplify things a little. What metrics are the most important for you to look at?
For the average marketer trying to track their results with SEO, these are the most important metrics:
- Average session duration
- Bounce rate
- Conversion rate
- Pageviews
- Sessions
- Users
These elements will allow you to see if your SEO is improving over time, if you are achieving your business goals, and how users interact with your website.
Average Session Duration
This one is self explanatory. The longer people stay on your website, the better it is for your SEO. This tells Google that your site is an authority in your niche. You want high numbers for this metric.
Bounce Rate
Your bounce rate is the percentage of users that leave your website. If you have a high bounce rate, this sends a signal to the big G that there is a problem. Either your website is sketchy, or it doesn’t have what people are looking for.
If you have a high bounce rate I would recommend checking for technical issues with your site.
Conversion Rate
This is the percentage of users that complete a desired action out of your total visitors. For example, a conversion may be to call your business, buy a product on your online store, or schedule a consultation with you. This is important to track so you can see if you are increasing your conversions over time through your SEO.
Pageviews
How many people are visiting your pages…? I know this one is simple, but it goes without saying that this is important to look at. If your page views aren’t increasing month by month, something is wrong with your SEO strategy. This number should consistently be going up over time, as long as you are sticking with the game plan.
Sessions
Sessions are the number of times a user visits your website. Some people often confuse this with users, but they are two separate things. Google looks for retention when determining what websites are authoritative. Users coming back sends a positive signal that you are doing things right.
Ideally you want 1.5x the number of users as your sessions metric.
This can vary depending on your niche and if you have any systems in place to bring people back. You can do this through an email list. Whenever you publish new blog posts you can send them out to your audience.
Users
Finally, we have users. This is the total number of unique visitors that have come to your website. There should be a correlation between the number of visitors you get and the amount of revenue your business makes. Increasing this is the most important thing you can do as a SEO.
Setting Up A Goal
I know we briefly touched on goals, but I wanted to include a step by step on how to set them up. Goals are extremely important and help business owners track the most important metric: return on investment. There’s no point to any of this if your business or clients aren’t making a profit.
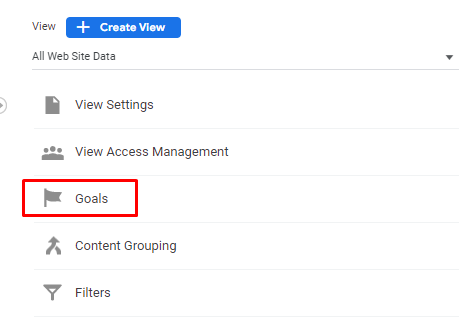
To set up a goal, start by clicking on “Admin” with the gear icon in the bottom left of the dashboard.

Then, click on “Goals” with the flag under “All Web Site Data”.
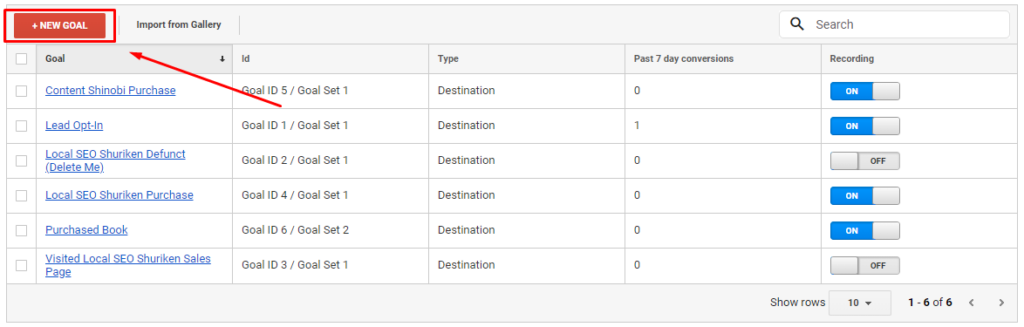
This will bring up the list of your Google Analytics goals. Click on the red “New Goal” button at the top of the table.
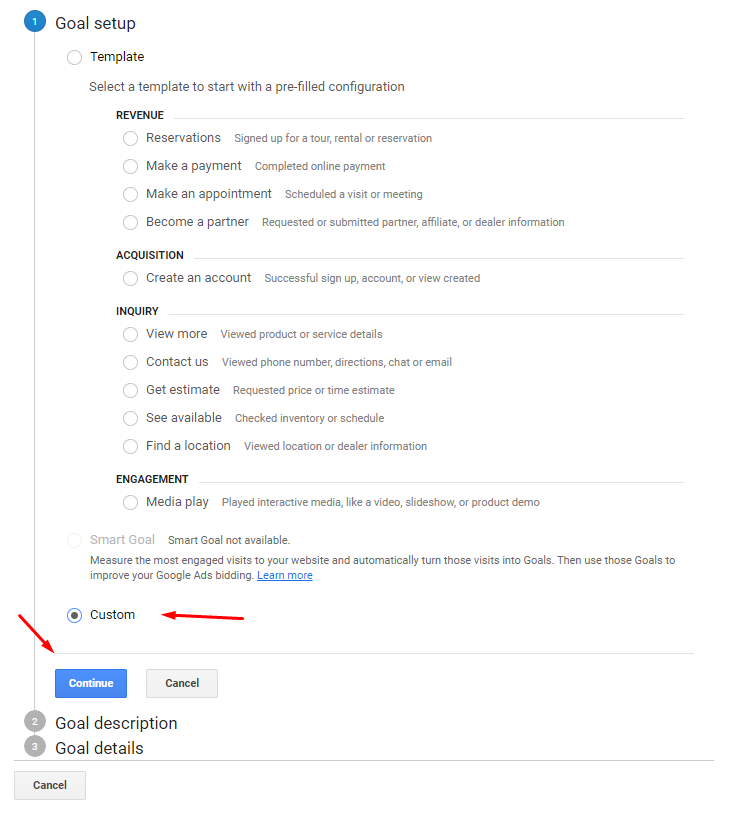
You’ll notice it will come up with a list of template goals. We actually don’t want to use any of these, so choose the “Custom” option at the bottom. Then, hit the blue “Continue” button.
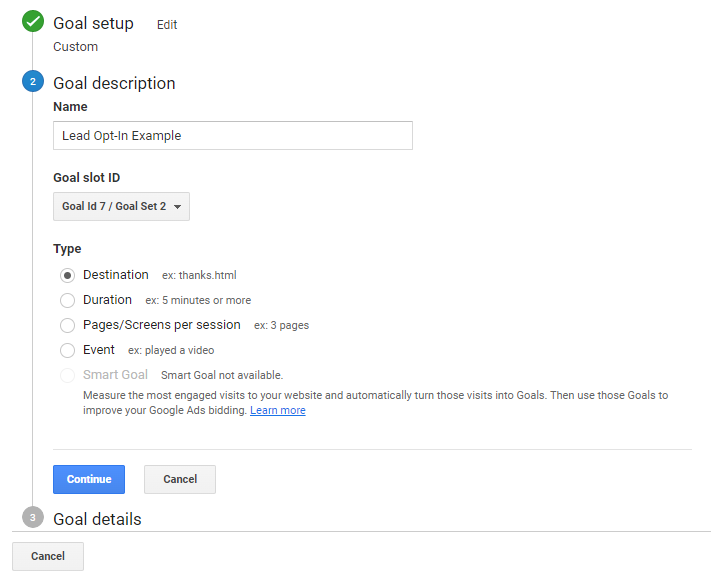
Enter a name for your goal. For this example I’m going to use an opt-in form for my email list. My goal is to get people to enter their email and land on the thank you page as a result.
I’m going to name this goal “Lead Opt-In Example”. You can name this whatever you want, but I recommend naming it something recognizable. That way you’ll immediately know what it is from a glance.
For goal slot ID, just leave that as it is. Different goals have different IDs, that’s all you need to know.
For “Type”, choose “Destination”.
Then, click on the blue “Continue” button at the bottom.
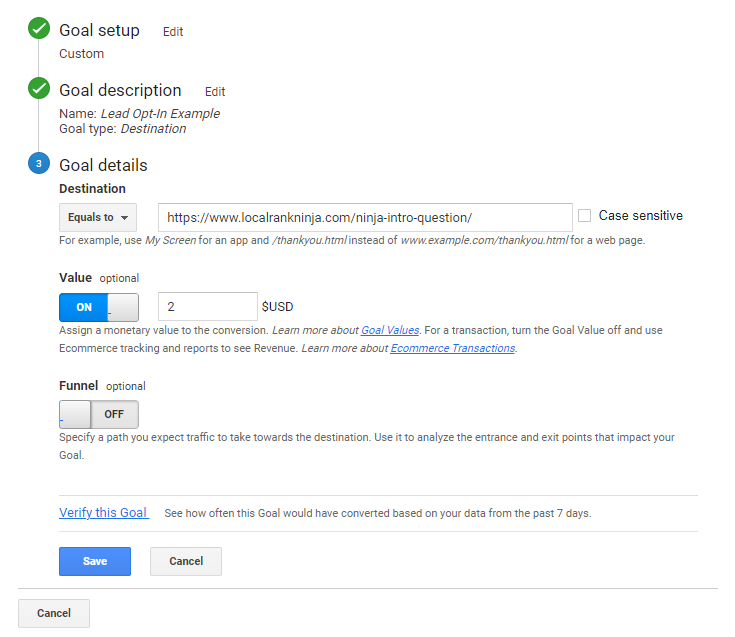
Now we can enter the URL of the page people visit once they complete this goal. It’s important to note the type of goal and process would be the same if you are trying to track purchases on an ecommerce store. When customers place an order, they get redirected to a thank you page.
I’m going to go ahead and pop in the URL of the page leads land on after they fill out the form.
Once I have the URL entered, I can choose to set a value for this goal. As I talked about earlier in this article, some conversions may be worth a monetary amount to your business. For this example I’m going to pretend a lead is worth $2 to me.
You can click on the blue “Verify this goal” link to check if tracking is working. If you’ve followed the setting up Google Analytics part of this article, everything should be running fine.
Go ahead and click on the blue “Save” to apply your changes and add the new goal to your Google Analytics account.
Boom! It’s literally that easy. By taking a few minutes to set up goals, your SEO efforts become 10x more trackable without much hassle. So many people skip over setting this up, and I don’t really get why.
Don’t be lazy! It only takes 5 minutes to do this and making data driven decisions is almost always worth it in both business and marketing.
Sometimes Data Can Be Inaccurate
Unfortunately, even despite how powerful Google Analytics is: it doesn’t always give you accurate data. The following factors can bias your tracking data:
- Filtering – Sometimes filters set in Google Analytics can mess up your data. If you exclude certain regions, occasionally users not from those regions will be thrown into those buckets, for example. This can happen due to users using VPNs or inaccurate browser reporting.
- Sampling – Occasionally Google Analytics will engage in what’s called sampling, or making estimations based on a subset of data. This is bad because it doesn’t always give you accurate results and numbers.
- Tracking Code Incompatibilities – Sometimes your tracking code will run into issues with other plugins on your WordPress website, and can cause tracking to not work. Even worse is when it appears to be working, but only tracks a handful of users.
- User Behavior – Users can enter, leave, and navigate around the site in a way that can confuse Google Analytics. Pair this with the countless browsers, extensions, and software tools that could be installed on people’s computers (like cookie blockers and adblock extensions) and you have a recipe for inaccurate data.
So what should you do instead…? Well, the unfortunate reality is that you will never be able to track everything perfectly. I know that may have sounded like a letdown, but remember: this is the exception to the rule!
Generally you will get mostly accurate data from Google Analytics, and in my opinion it’s still worth basing business decisions on said data. If 90% of the data is still correct, that’s a ton of real information you can leverage and tap into.
Google Search Console
Google Search Console is like Google Analytics, but it’s used to track other bits of data about your SEO. Think of this tool as more of a center for feedback from Google about your website. Search Console is neat in that you can get a feel for what the big G thinks about your site.
Inside Google Search Console you’ll find:
- How Google sees your website
- How it’s performing in search results
- Any problems that are negatively impacting your ranking
- Search queries that landed users on your website
- Detailed logs of information about any errors
This is really useful as we can immediately identify any issues with our website. Additionally, we can track our rankings for different keywords and search phrases. And keep in mind: this data is coming right from Google, so it’s as accurate as it gets!
Setting Up Google Search Console
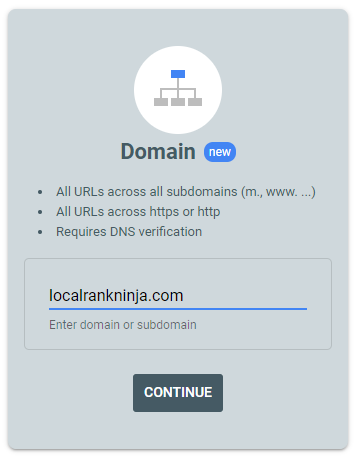
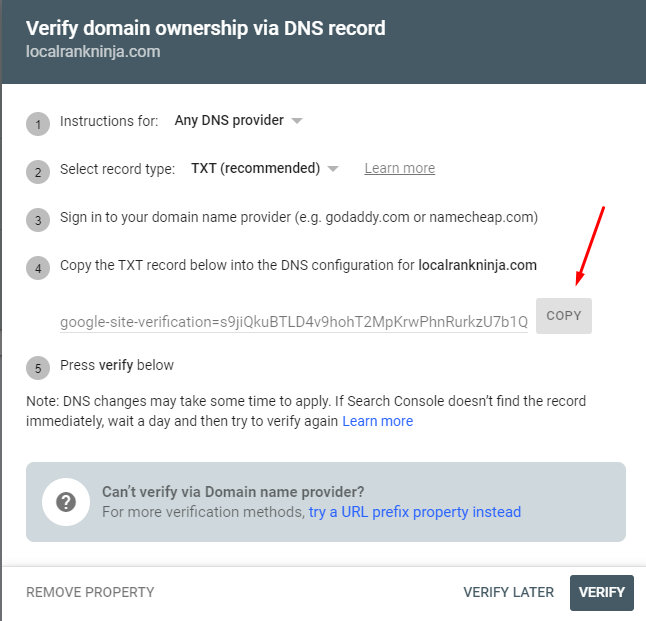
To set up Google Search Console, first head over to their website. A welcome screen will pop up, prompting you for a few things. Enter your website domain in the domain box, and click on the “Continue” button.
It will then prompt you to verify that you are the owner of this domain. Search Console will give you a TXT record for verification. I know this looks overwhelming, but stick with me – it’s actually super easy!
Simply click on the “Copy” button and log in to your web host.
I’m going to be using GoDaddy for this example.
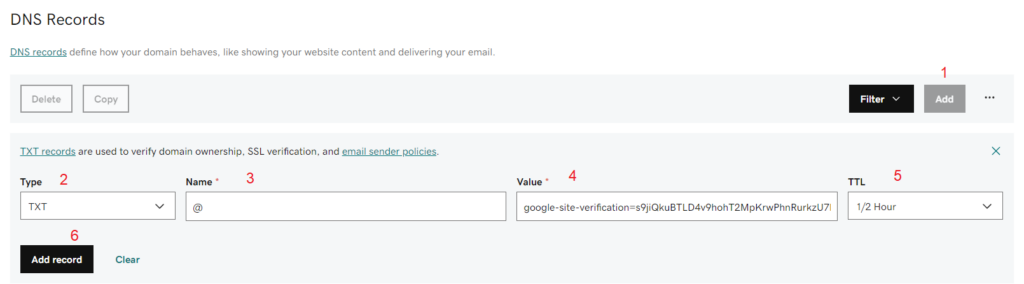
Once inside, click on “Domains”, select your domain, and then click on “DNS”.
At the top there will be a black “Add” button. Click on this.
For type select “TXT”. Under the “Name” box enter the @ symbol. For value paste the thing we copied from Google Search Console. Selecting the “TTL” dropdown, choose the smallest available number and click on the “Add record” button at the bottom.
Once that’s done, head back to Google Search Console. Click on the “Verify” button at the bottom. If everything was done correctly, it should verify your ownership of the website and add it.
It’s important to note that sometimes it takes a moment for DNS servers to propagate. If it is failing to verify it, wait 24 hours and try again. That should fix the issue.
Boom! We now have Google Search Console set up. Now let’s talk about the important metrics to look at it in here, along with some additional steps you may want to take for the best SEO results.
The Most Important Search Console Metrics
There are 4 primary data points we want to look at when it comes to Google Search Console.
- Average Click Thru Rate (CTR)
- Average Position In Search
- Total Number of Clicks
- Total Number of Impressions
Average Click Thru Rate (CTR)
Your click thru rate (CTR) is the percentage of people that choose to go to your website in the search results. This is affected by your page title, meta description, keywords/search phrases, and slug. These are all things you can specify and tweak using a SEO plugin like Yoast.
To improve this metric, you need to make your result captivating.
Try to think of what people who are quickly skimming the search results want to see.
Average Position In Search
On average, is your website showing up #1 for search queries…? Oftentimes I’ve seen people freak out because of how low this number is, but it’s important to understand what’s going on here. This is an average position number of ALL the searches you are showing up for, not just one keyword or phrase.
For example, my website LocalRankNinja.com shows up for “ninja” sometimes. That’s not really a relevant search phrase, so of course I would show up low for that particular word. It’s important to take these numbers with a grain of salt and not literally.
In my opinion, looking at your overall traffic changes month to month is a far better measurement of how your SEO is actually doing.
Total Number of Clicks
Ah, the total amount of clicks to your website from search. This is a very important number, and you’ll want this to be increasing over time as much as possible. Few clicks may be due to your website not having enough authority yet.
It’s important to keep going. In the beginning impressions are going to be high, and clicks are going to be low. Keep publishing high quality content and continue to build E.A.T. (Expertise, Authority, and Trust) across the web.
Total Number of Impressions
Finally, we have impressions. This is how many times your result was seen (but not necessarily clicked on) in search. Sometimes an impression also leads to a click, but not always. Ideally this number should go up over time, as Google gives you more rank juice and pushes your website out further in search.
If impressions dramatically go down, that may indicate there is an issue that needs to be addressed. This could be anything from Google having a problem with your website, to a technical problem that may show up in Google Search Console.
The Importance of Sitemaps
Besides this, we can also submit a sitemap to Google. I’ve covered how to do this before on this blog. Here is my sitemaps explained in under 1 minute video:
This is crucial and only takes a minute to do. To give a TLDR, a sitemap is a list of all pages and blog posts on your website. As you publish new content, the sitemap is automatically updated., You can submit this to Google in link format, so they are simply pointed to the auto-updating sitemap on your website.
Then you can rest easy and let automation take care of the rest. By submitting a sitemap, Google can see all of your content. This way you ensure it will be indexed in search, and they won’t miss it.
Submitting One
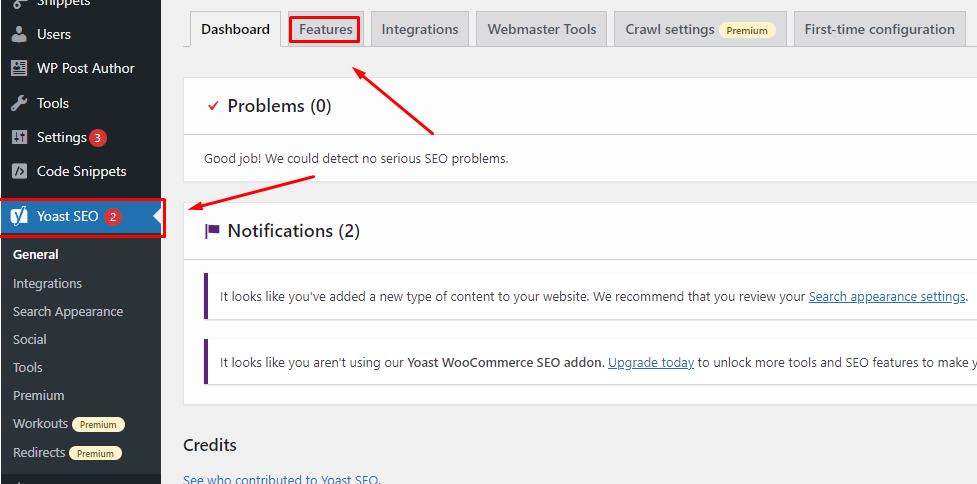
To submit a sitemap, you’ll need to have Yoast SEO installed on your WordPress website. Head into your WordPress dashboard and click on the little “Y” icon to bring up Yoast. Then, click on the “Features” tab at the top.
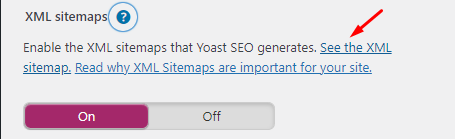
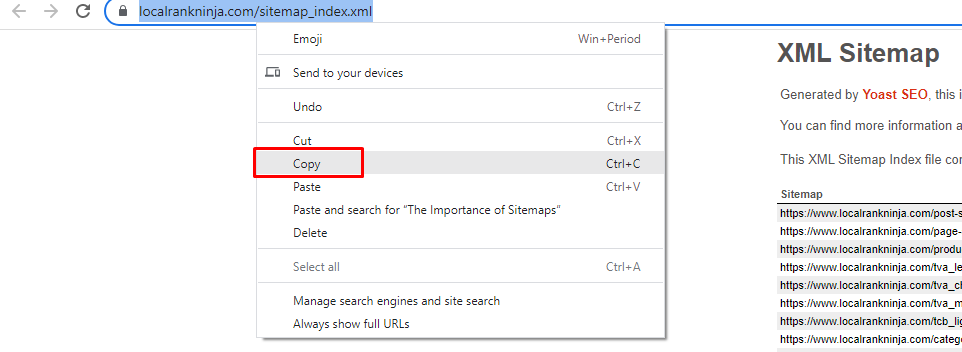
Click on the question mark next to “XML sitemaps”. This will pop up will an option to see your sitemap. Clicking on this will give you the link for your sitemap. Copy the URL from the top bar inside your web browser.
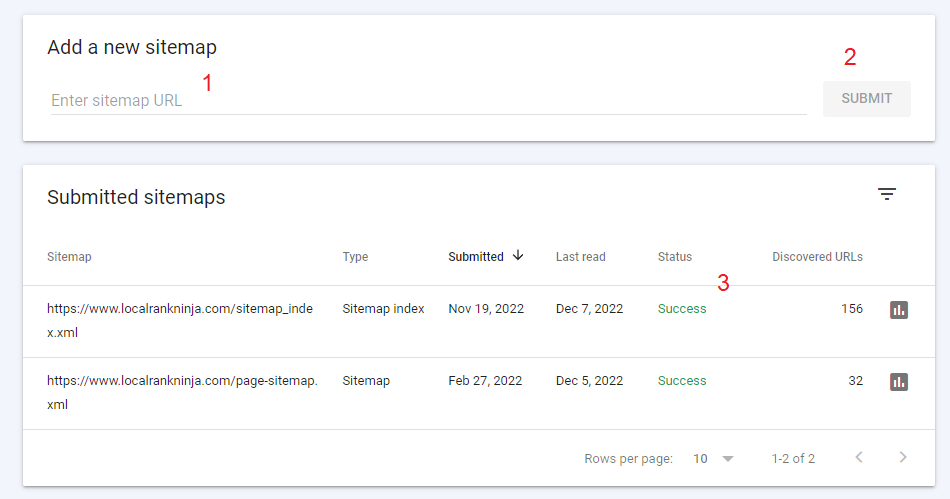
Now we have what we need. Head over to Google Search Console. Once inside, click on “Sitemaps” under ‘Indexing” on the left.
Paste your sitemap URL in the box and click on the “Submit” button. If all goes well you will see the word “Success” in green to the right of your submitted sitemap. If it fails for some reason, try submitting it a second time. I’ve ran into this a few times while doing sitemaps for clients, and this almost always fixes the problem.
Ta da! That’s literally all it takes. Google is now indexing all of our pages on our website.
Remember: Marketing Data Only Gets You So Far
At the end of the day, as marketers we love to obsess over the numbers. But data will only get you so far. You need to tread a fine line between using the numbers to improve, and also not obsessing over them to the point where you get distracted.
I’ve seen this happen a lot to newer SEOs, and it’s unfortunate. Numbers aren’t always everything, and can be biased or even outright wrong. Now usually, that’s not the case.
But it’s important to keep this in mind. If you aren’t seeing numbers that make you feel good about your SEO, don’t panic. Stick with the program and remember that good SEO takes anywhere from 6 months to 1 year to see results.
Besides marketing numbers, there’s actually more valuable metrics that ultimately take priority over them. And that’s business numbers.
Talk Business Instead
At the end of the day, marketing metrics can be artificial. If you’re not achieving your business goals, there’s no point to SEO.

Above all else, these are the metrics that matter the most:
- Revenue
- Cost Per Acquisition (or CPA)
- Return On Investment (ROI)
- Brand Awareness
Let’s break down these 4 in depth.
Revenue
You need to be tracking how much additional money is flowing into your business from your SEO efforts. CEOs and business owners are going to care about revenue increase more than anything else. If you’re a marketer your job is to grow your client’s business, and this is a direct reflection of that.
It’s important to have the ability to prove with real numbers that what you are doing is working. This is how you build leverage so you can petition for more tools and resources if you work for a company. As a digital marketer you should still report this to your clients.
It will separate you from the competition and show them you are dedicated to getting them results. That’s a great way to increase your monthly retention and keep clients wanting to work with you.
Cost Per Acquisition (CPA)
This one applies more to paid advertising, and can be quite hard to track with SEO. There is a formula you can use to calculate this number, however.
Total Amount Spent On SEO (In 1 Month) / Total Number of New Customers (Acquired Through SEO)
You may need to use both Google Analytics & Google Search Console to get the number of acquired customers variable.
In the beginning you may be losing money on SEO, but over time the amount of customers acquired should surpass the amount spent in a given month. Give SEO around a year to become profitable. If it is still not, I would recommend looking into working with a different SEO expert or changing your strategy (if you do the SEO yourself.)
Return on Investment (ROI)
This one piggybacks off of Cost Per Acquisition. Are you getting a return on your investment in SEO? One of things I didn’t mention previously is that some customers may find you as a result of SEO, but Google Analytics won’t report this.
For example, if you’re a local business and you show up in Maps some people may just google your business, then show up at your location. Because they didn’t complete a conversion-based goal, it’s not going to show up in Google Analytics. It’s important to ask people how they heard about your business and keep a tally sheet.

You can then compare these numbers with the ones found inside of Google Analytics & Search Console. You may be surprised that your SEO is working far better than it appears!
Brand Awareness
These are transitioning into each other perfectly. Finally, we have brand awareness. This goes along with what I just said about numbers not always reflecting the business growth you are experiencing.
Your SEO may also indirectly lead to increased word of mouth, which will also bring more new customers in the door. People tell their friends and family who they buy from, and you may find yourself getting a phone call months from now from someone referred by another guy who found you in Google.
Again, keep some sort of in-person reference outside of online tools for tracking numbers. Have a pen and paper on your desk, and ask people how they found out about you. I can not stress this enough.
Conclusion
I know we covered a lot in this article, so I’m going to break down the TLDR for you. Google Analytics and Google Search Console are two great, free tools you can use to track your results with SEO. It’s important to understand the key metrics mentioned in this article and what they mean.
Understanding both marketing metrics and business metrics helps you stay on top of everything and ensure you are gaining money, not losing it.
Want To Be A SEO Ninja…?
If you want to learn powerful, proven, and effective SEO techniques check out Local SEO Shuriken. It’s the best course I have ever created and teaches you how to easily do SEO the right way step by step. It’s the ultimate resource for business owners and marketers looking to learn proper search engine optimization.